24/7 hotline · NDA before any technical detail · You don’t have to be a client already
Three services. One defensive operating model.
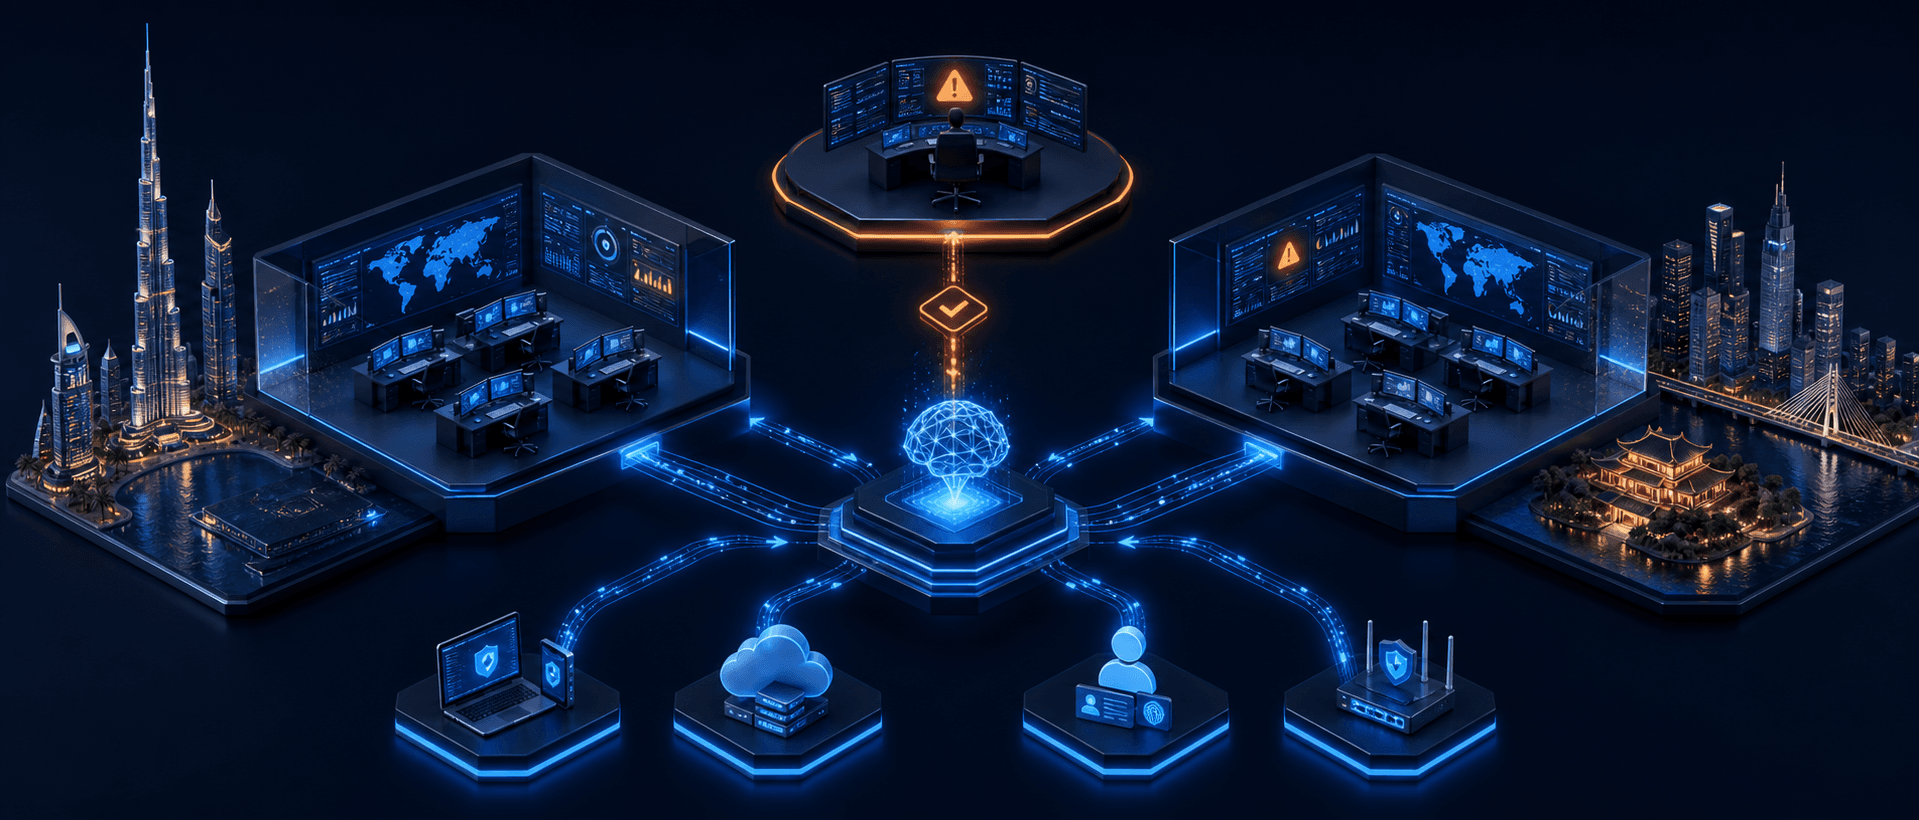
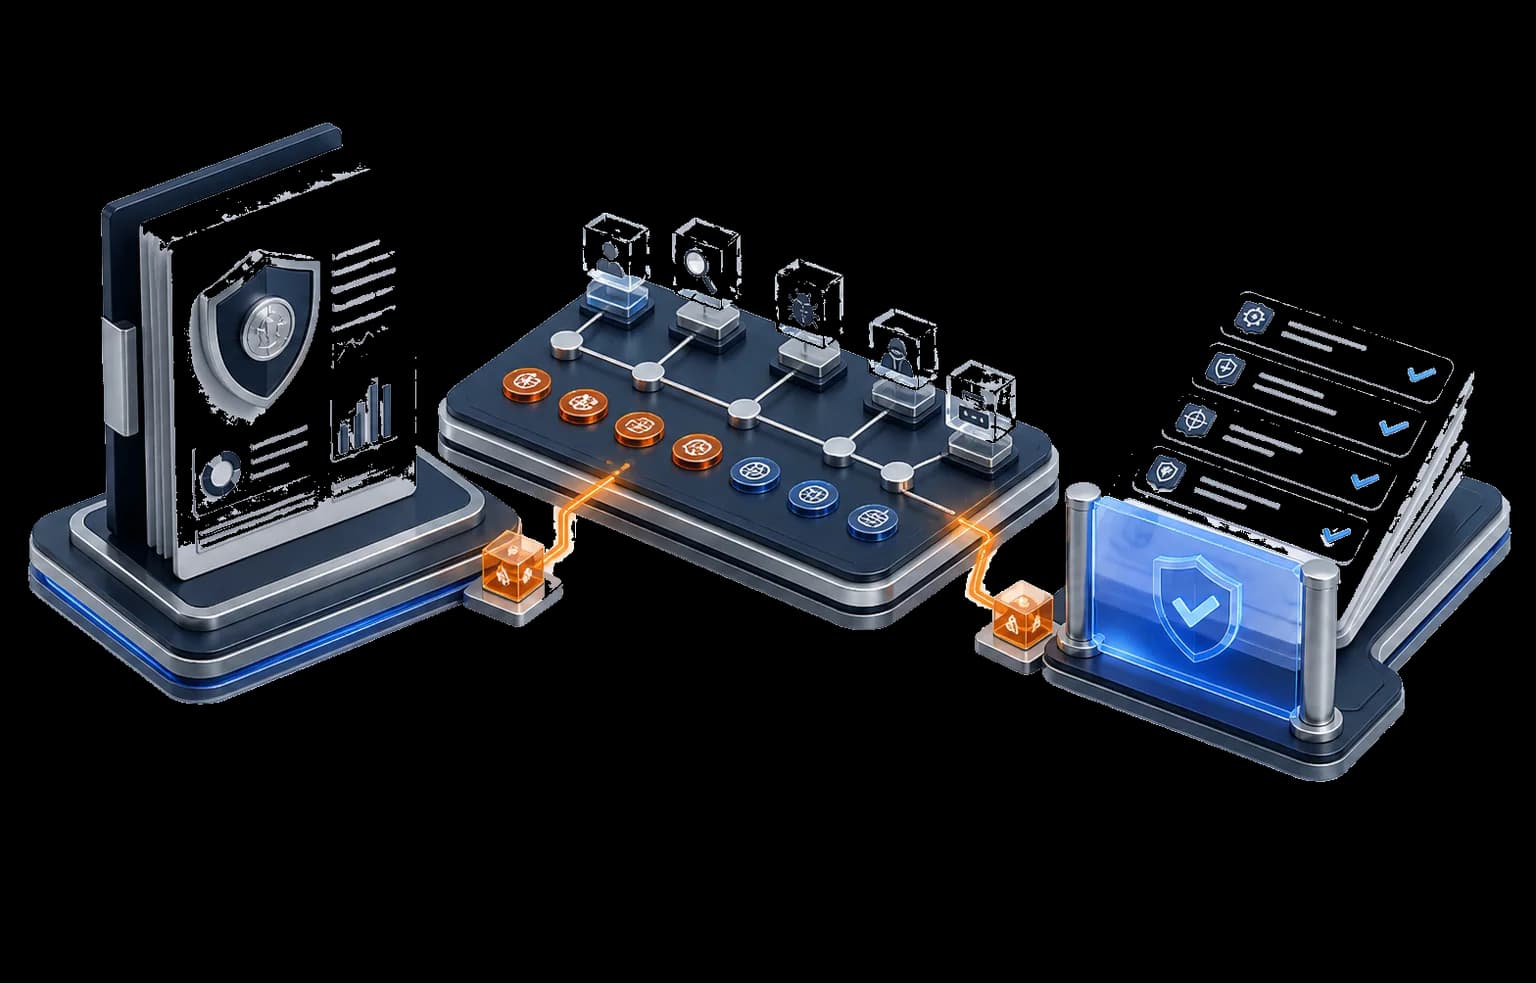
Start by making security telemetry usable, monitor it continuously, and respond with the same evidence when an incident occurs. Explore each service in detail below.
Most breaches aren’t missed for lack of tools. They’re missed because the log that would have shown them was never sent.
You bought the firewall. You bought the EDR. You bought the IPS.
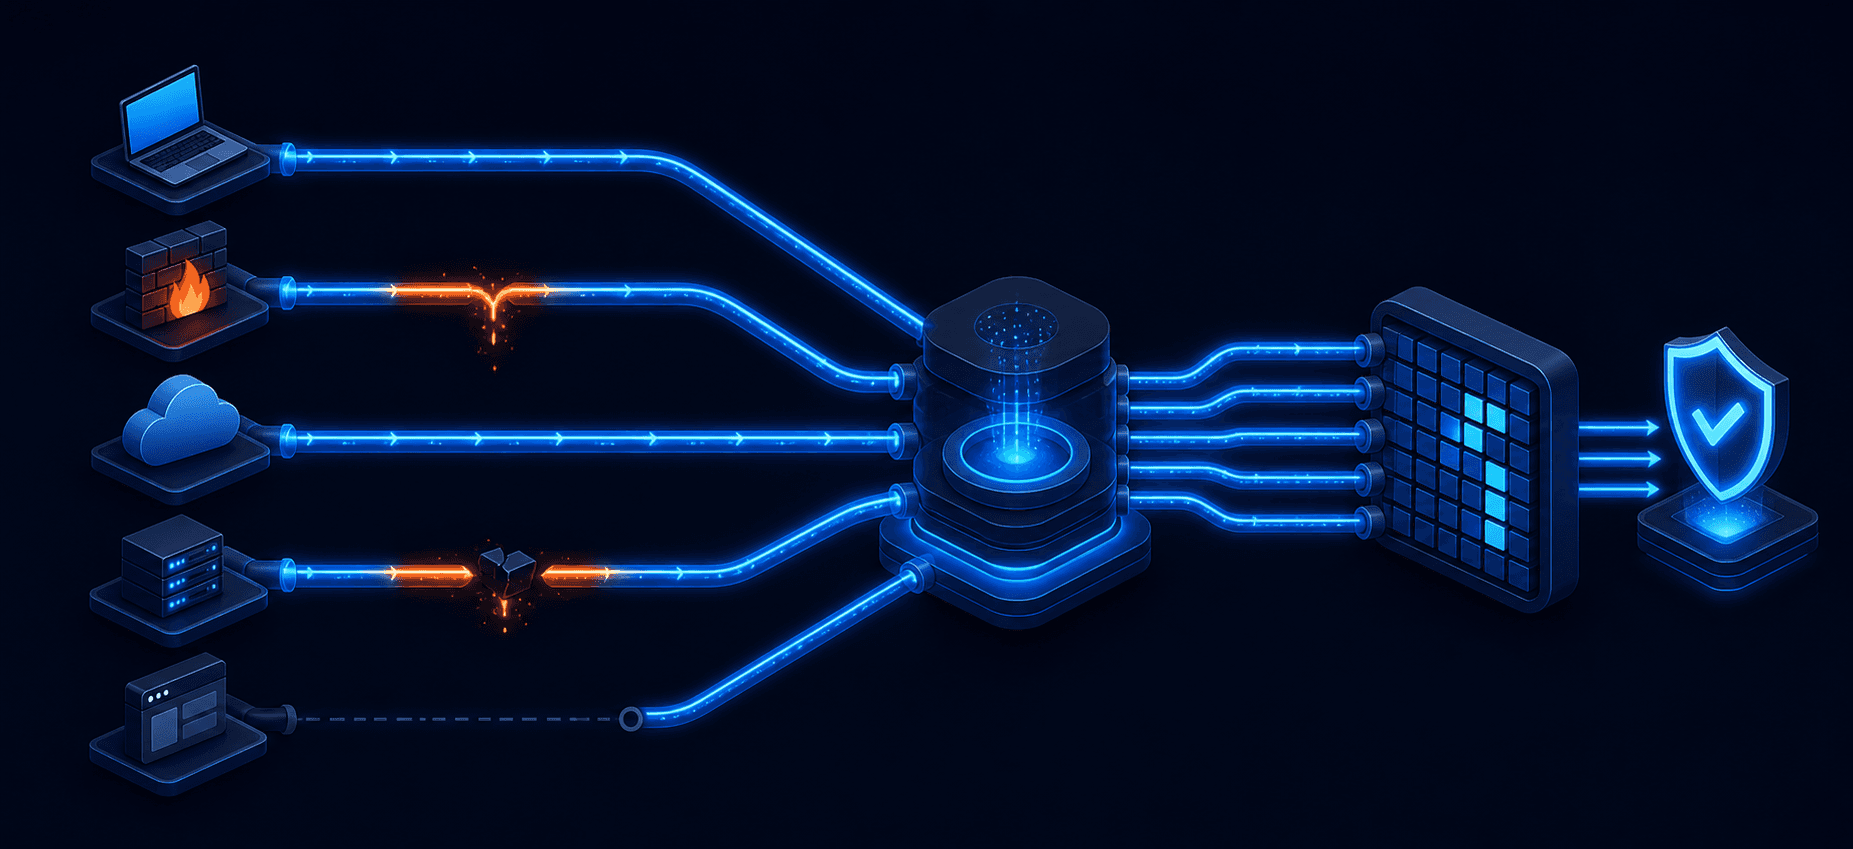
Then an incident happens, and what’s missing isn’t analysis — it’s data. A sensor that’s switched on but not recording the event class that matters. Logs that stop at the appliance. A source that went quiet six months ago and nobody noticed. Or logs that arrive carrying nothing to say which system they came from.
So we work in this order: clear the log pipes, monitor 24/7 on an AI-integrated platform, respond when it happens. Skip the first and the other two are theatre.
24/7 SOC monitoring
Round-the-clock monitoring. The AI reads first. A human decides.
Aletheia is our own SOC platform. Everything from your estate is normalised into one schema, then run through three detection layers that overlap on purpose: baseline rules, real-time behavioural correlation, and threat hunting. Miss a technique at one layer and two more are still in front of it.
Every alert gets triaged — every one, not every batch
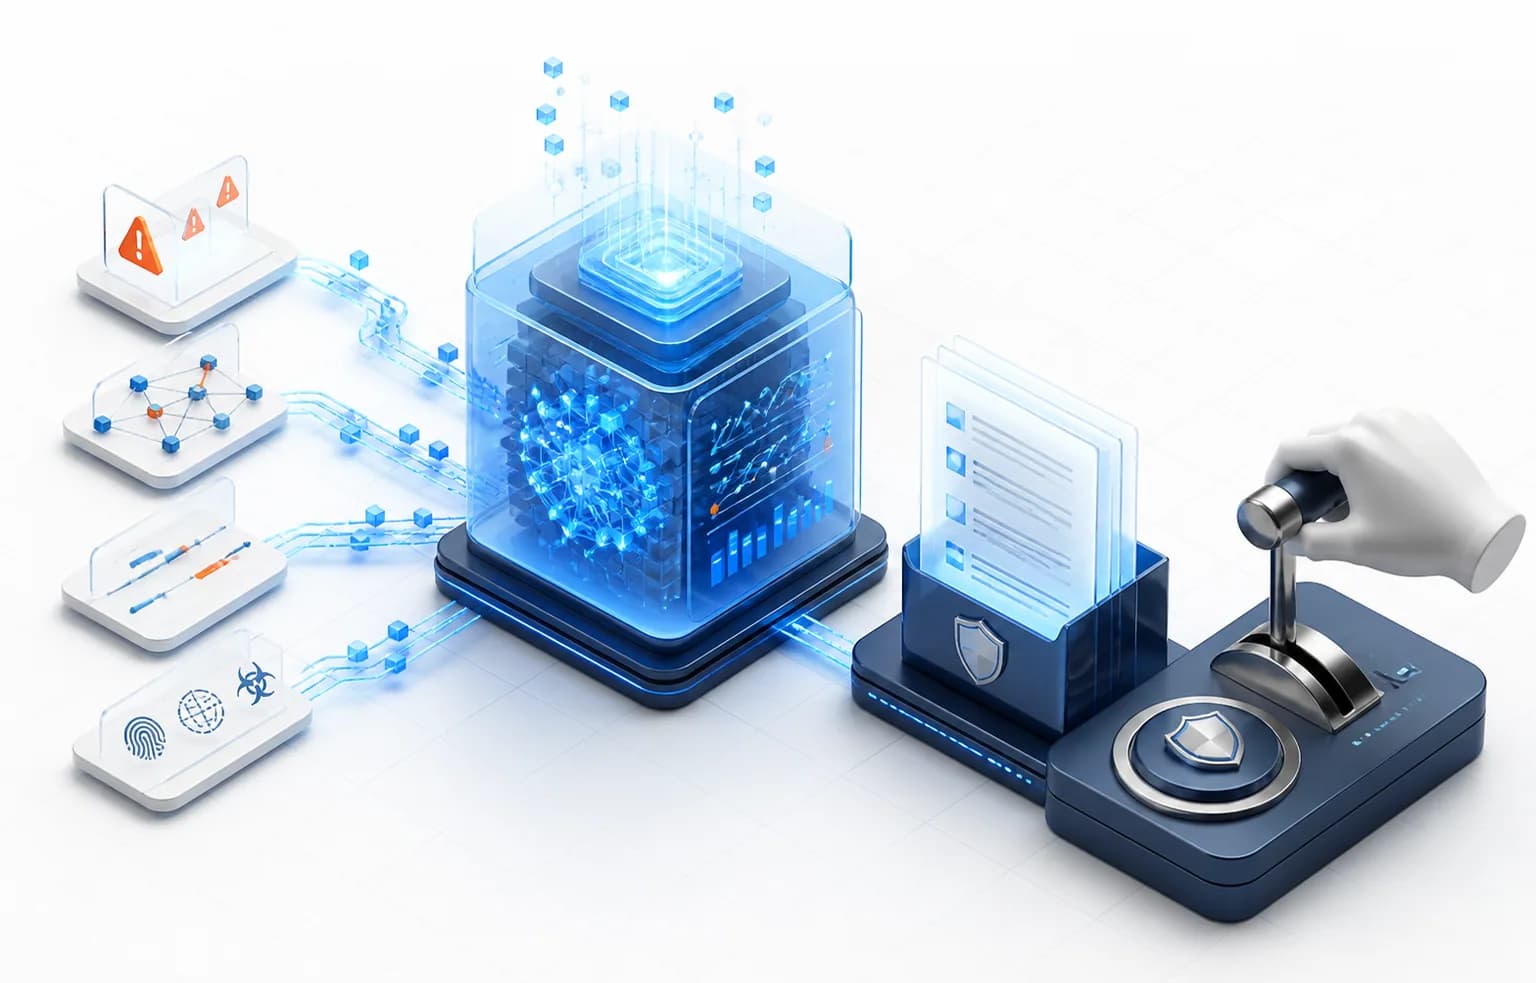
An AI agent reads each alert against its context: that user, that host, what happened either side of it. It comes back with a verdict, its reasoning, and a confidence level. It does this at 03:00 as readily as at 15:00, and it doesn’t depend on whether the shift had time to look.
Analysts make the call
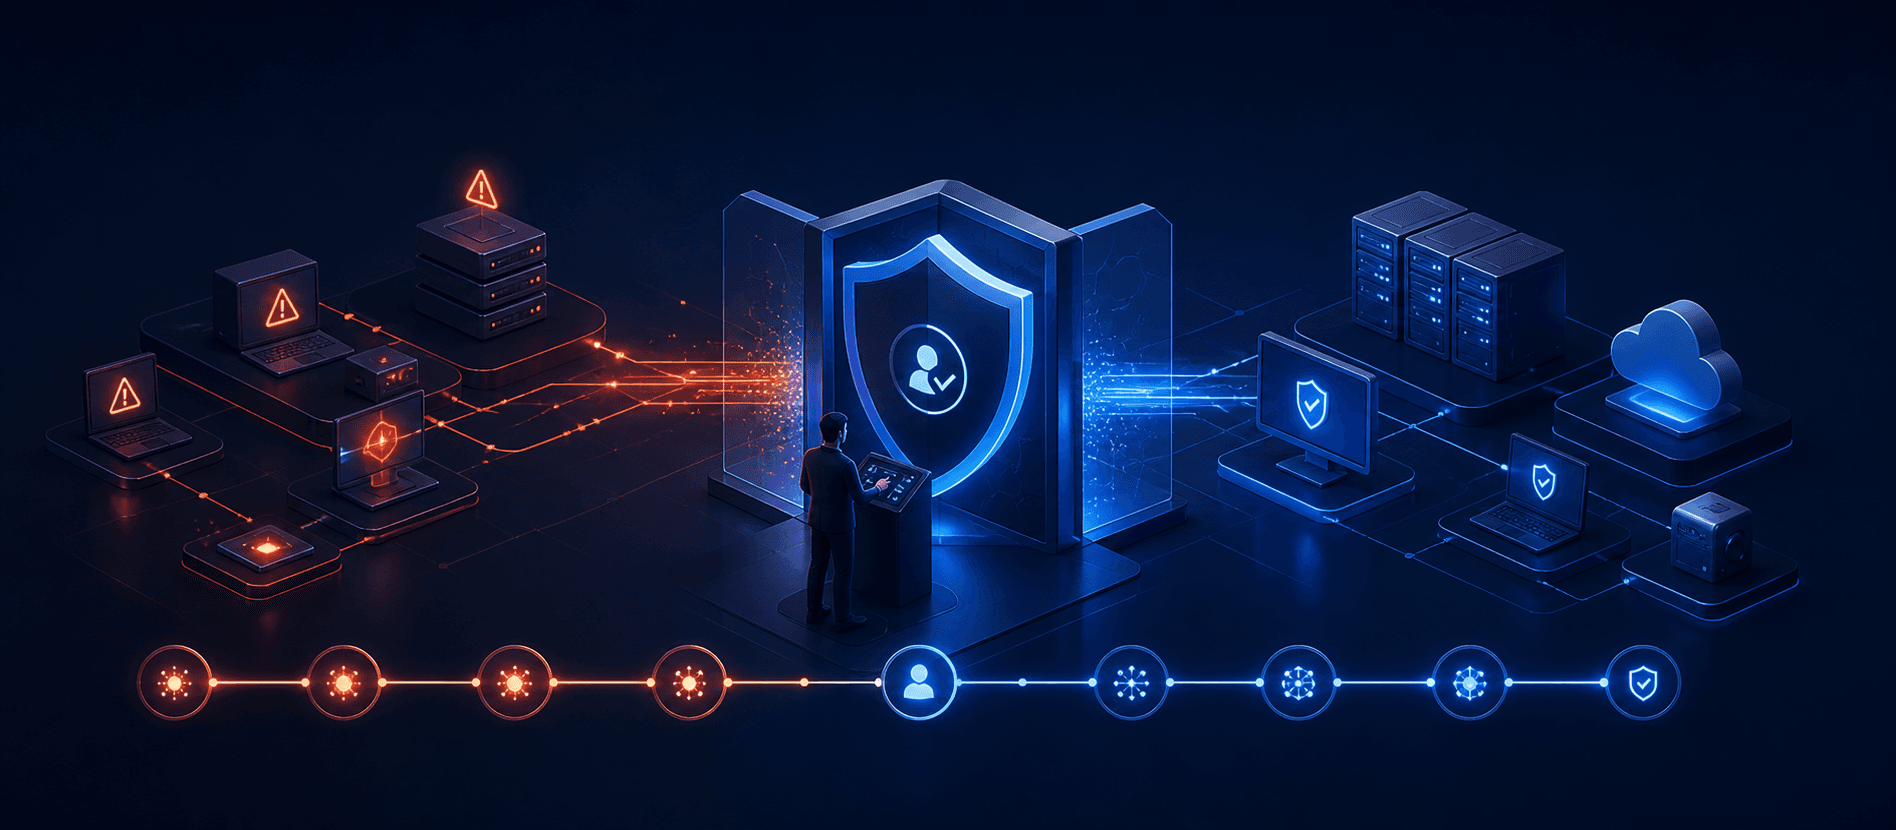
The AI proposes. It does not act. The platform will not isolate a host, disable an account or block an address on its own. A human closes every case, and that verdict feeds back: noisy rules get down-weighted or muted, good conclusions get remembered and reused. The platform gets quieter the longer you run it.
The AI runs on your hardware. Your logs stay home.
The models run on GPUs on site. No public AI service is called. If you’re a bank, an insurer, a telco, or anyone with data residency obligations, that’s a precondition — not a premium tier.
We’ll tell you what we can’t see
Counting rules isn’t measuring coverage. A rule that matches nothing looks exactly like a clean estate. Our platform separates wired — the platform would run it — from proven to fire — something repeatable shows that it does. You get both numbers, and the list of what’s still a blind spot.
Incident Response
When it happens, you don’t start from zero.
Our responders work on the same platform already watching your estate. The case opens with the timeline, the IOCs, the affected hosts and accounts, and the investigation tasks already in it. No scramble to pull logs out of six teams first.
Not a monitoring client? We still take the call. The first job then is standing up emergency collection, so there’s something to investigate.
What to expect
On contactWe pick up and steady the situation.
One technical lead is assigned to you. NDA signed. We tell you what to do now — and what not to do, so the evidence survives.
Stage 1We classify it and draw the first boundary.
Ransomware, BEC, data theft, insider misuse. Which systems are in scope.
Stage 2We reconstruct the timeline.
How they got in. How they moved. What they touched. Whether data left.
Stage 3We contain it.
You approve the containment plan before we run it. We don’t cut production systems on our own authority.
CloseWe report and hand over.
Findings, prioritised remediation, and new detections deployed into monitoring so the next attempt surfaces sooner.
What you’ll receive
An incident report your board can read. What happened, how far it went, what evidence backs that. Technical detail goes in the appendix, not the summary.
The attack timeline and the IOC list. Ready to sweep the rest of your estate, and ready to hand to a partner or a regulator if it comes to that.
A prioritised remediation plan including the new detections already live in monitoring, so you can show the gap is closed, not just logged.
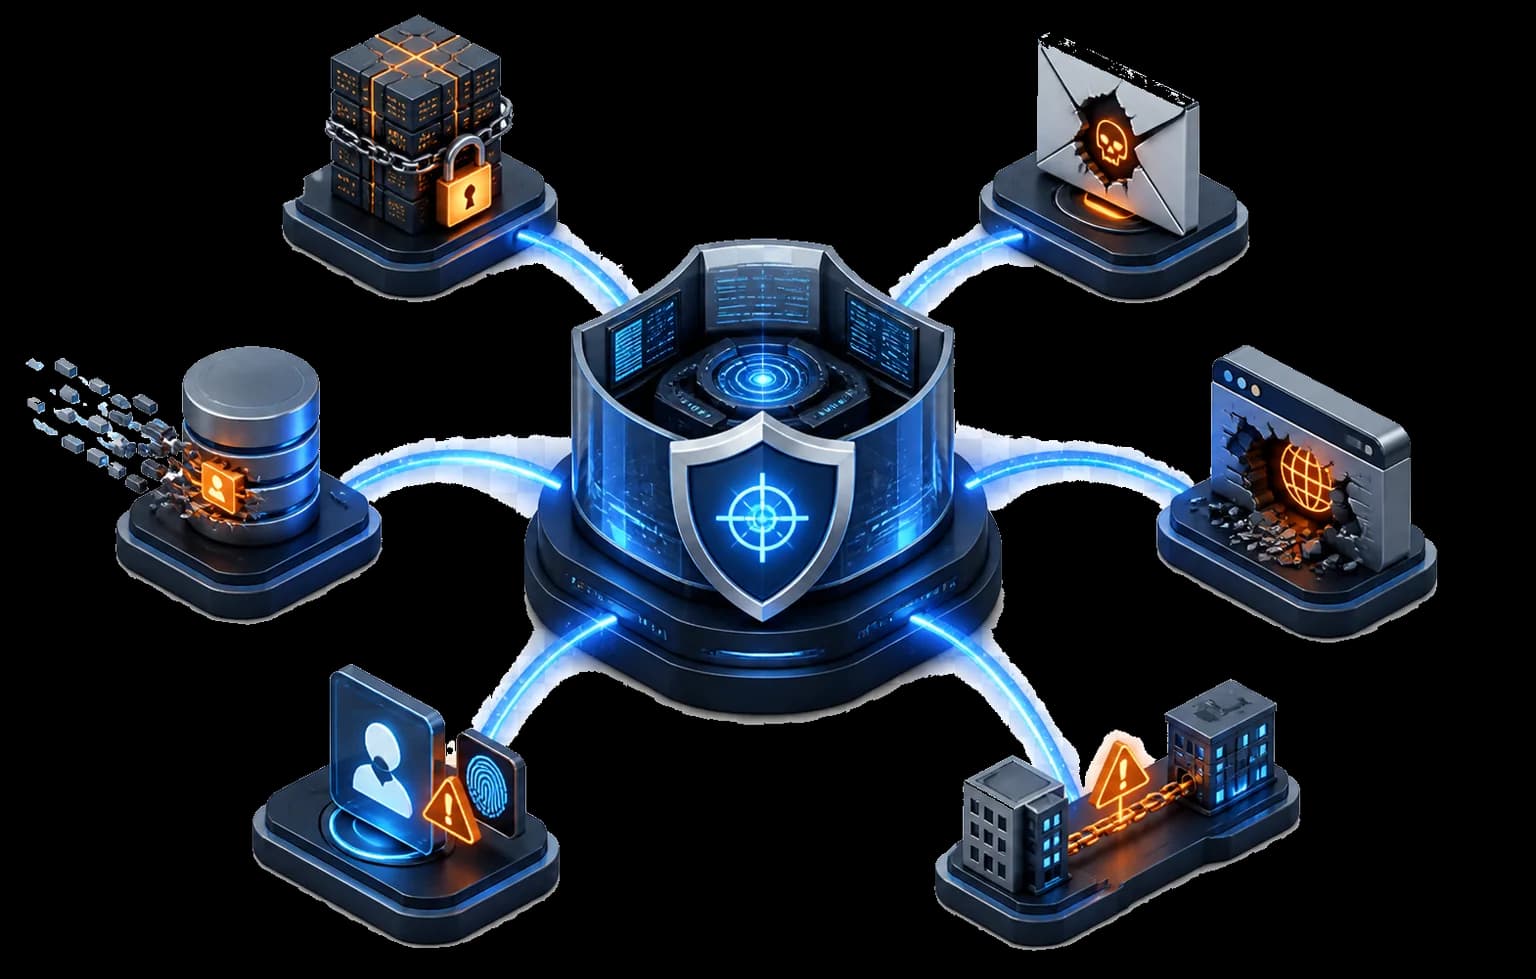
Incident types we handle
Ransomware
data encrypted, usually with a threat to leak it.
Business email compromise (BEC)
a mailbox taken over to redirect payments or read quietly.
Data breach
customer or internal data taken out of the estate.
Web application compromise
a vulnerability exploited to plant a backdoor.
Insider risk
legitimate access used for something it wasn’t granted for.
Third-party breach
a supplier is compromised and it reaches you.
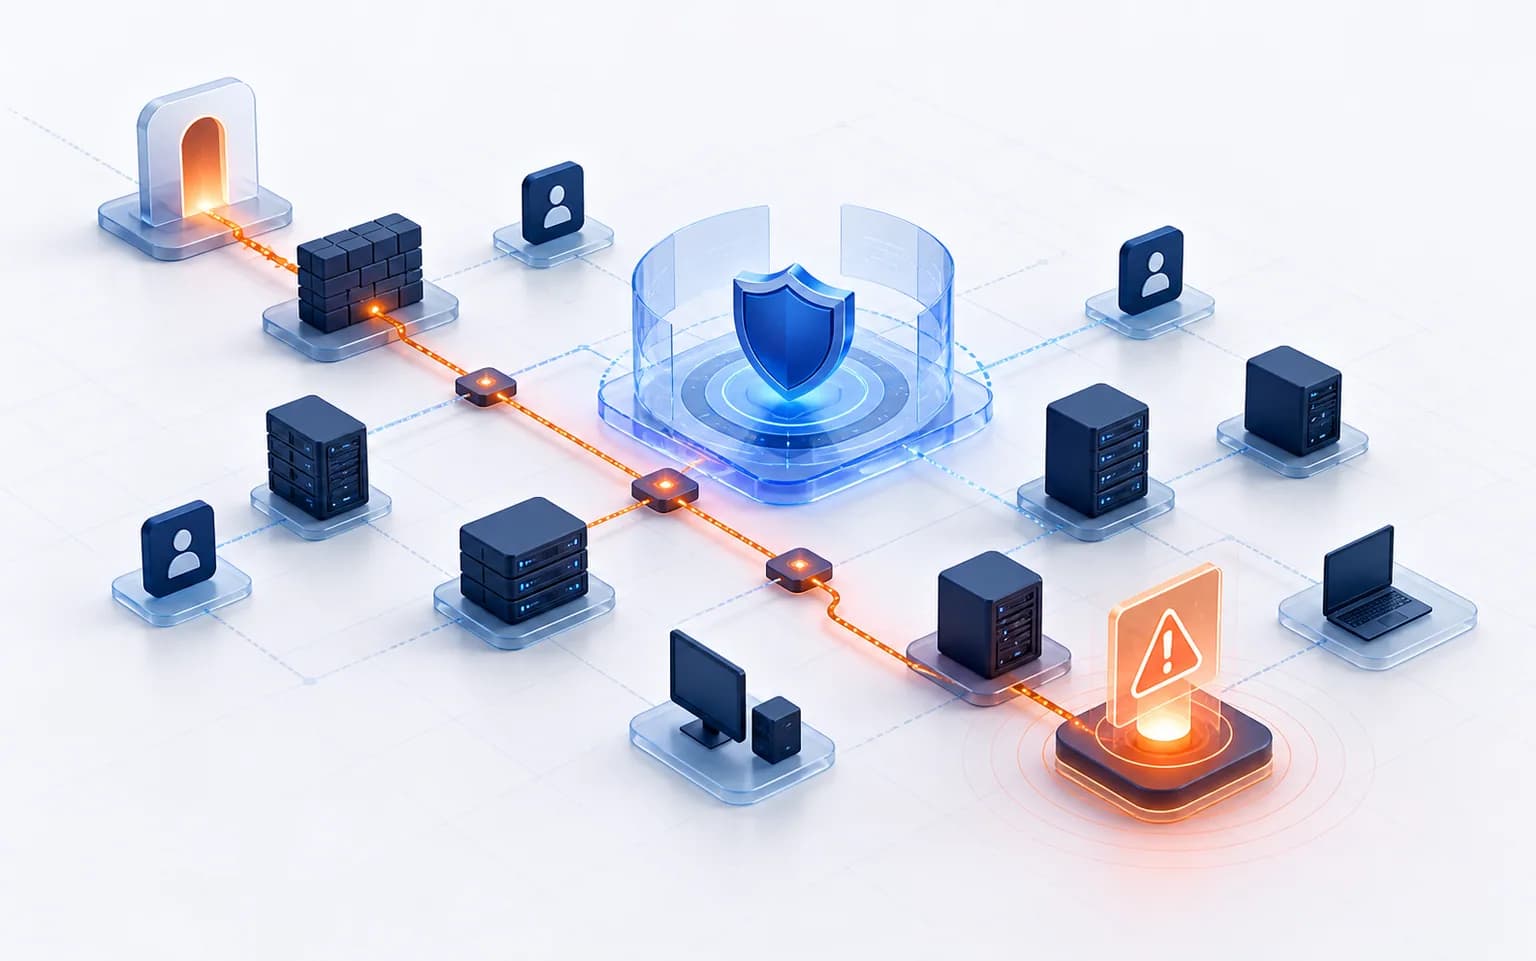
Targeted intrusions and APT
The alert is not the intrusion. It’s the first thing that happened to be visible — and it’s late.
A targeted intruder is found late by definition. So the investigation runs backwards toward the entry path, not outward from the alert: how long, how far, how they got in.
Months of history, queryable.
Every hunt re-runs across retained data — which is how an exfiltration spread thinly over a fortnight gets found at all.
Related alerts become one case.
Alerts sharing an entity fold into a single campaign instead of forty tickets that each look minor.
Every case opens with its neighbourhood.
One hop of the entity graph comes attached, so lateral movement is visible rather than reconstructed.
Severity follows the asset.
Malware on a payment host means segmentation, jump host and application auth were already crossed. The case says which — and that says where to look next.
What the AI does in an investigation
It performs the steps an analyst repeats identically every time:
pulls the context around the alert — that user, that host, either side of it
expands entities one hop and attaches the neighbourhood
enriches every indicator against reputation and intelligence
drafts the timeline, the IOC list and the affected assets into the case
seeds the standard investigative tasks, so the process holds at 4am
proposes a verdict with its reasoning and a confidence level
An analyst decides. The AI does not contain, isolate, disable or block.
Every step it took is recorded in order and can be replayed — you audit its work, not just its conclusion.
Where we respond
Cloud & SaaS
Control-plane and audit trails normalised like any endpoint log, so a cloud step and a host step land on one timeline.
Containers & Kubernetes
Cluster audit, workload events, runtime security, and the virtualisation layer under them. A pod that is gone cannot be imaged — which is why collection is continuous, not reactive.
On-premise
Windows, Linux, macOS, firewalls, proxies, VPN, directory, network sensors. No central logging? We collect with the free forensic toolkit and replay it into the same pipeline.
OT, ICS & IoT
See below — the limits matter more than the claim.
OT, ICS and IoT. We work where OT incidents are actually investigated: the IT side of the boundary — engineering workstations, HMIs, historians, jump hosts. We do not install agents on PLCs or RTUs, and we do not touch controllers on a running process. OT assets are recognised by host naming and vendor stack and weighted at the top of the criticality scale, with the controls an alert there implies were already crossed: the IT/OT boundary, the DMZ historian relay, engineering-workstation access.
What we don’t claim: ICS protocol content — Modbus, DNP3, S7comm, IEC-104 — is not parsed into detections. ICS network visibility reaches us through the IDS feed; safety-instrumented systems are out of scope.
Deployment
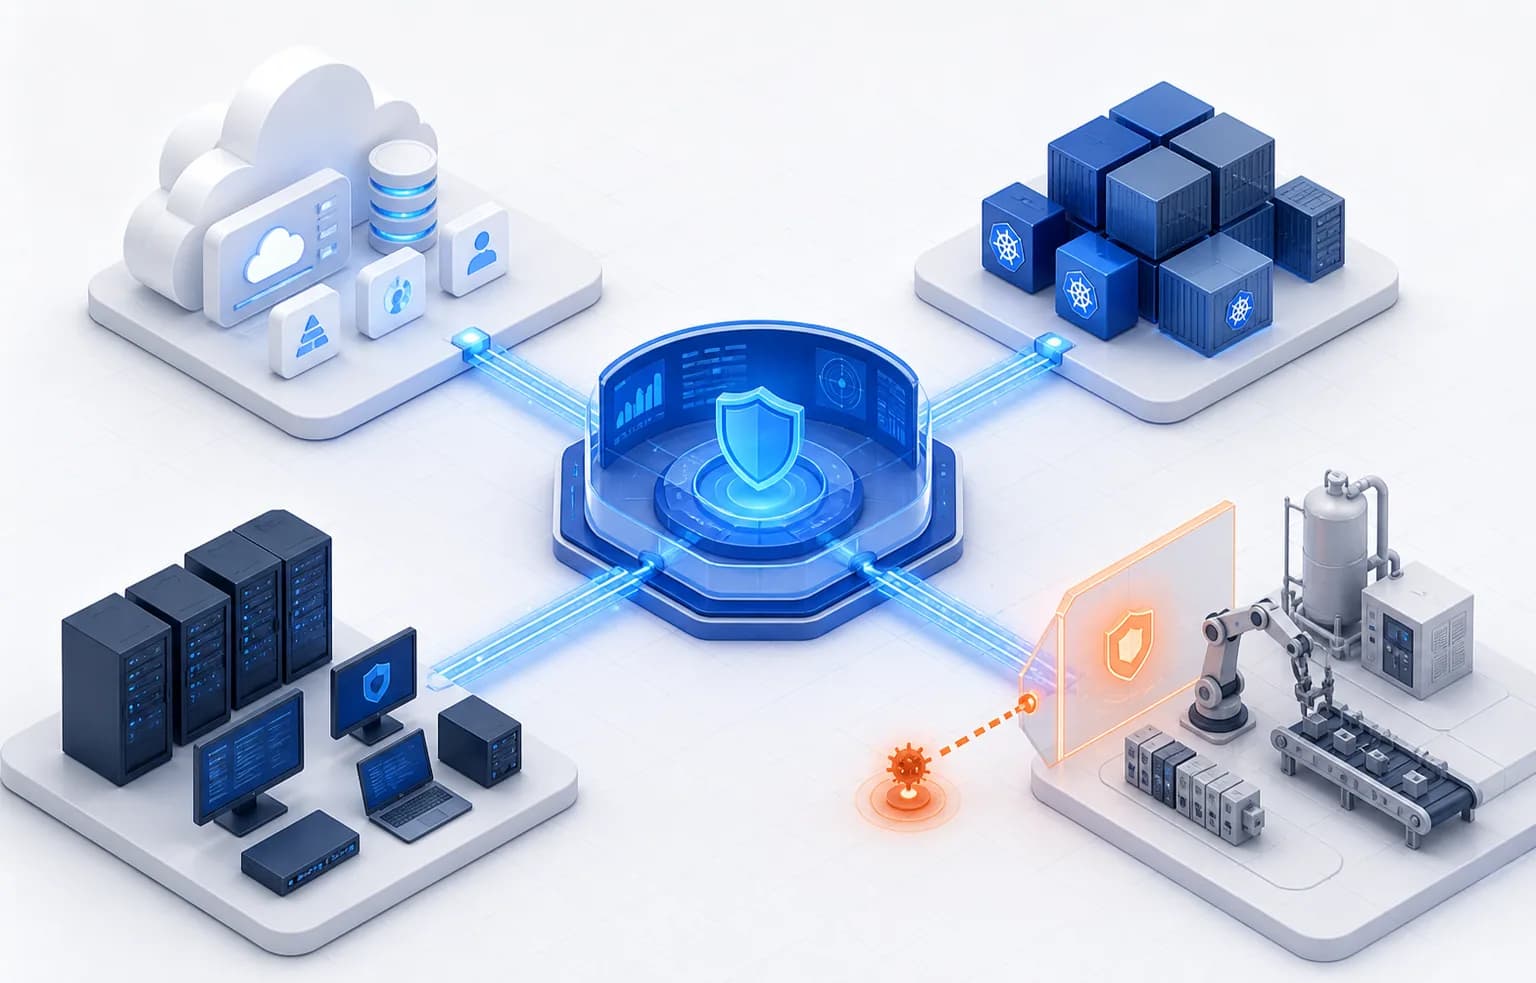
On-premise, on-cloud, or split. Same platform, different address.
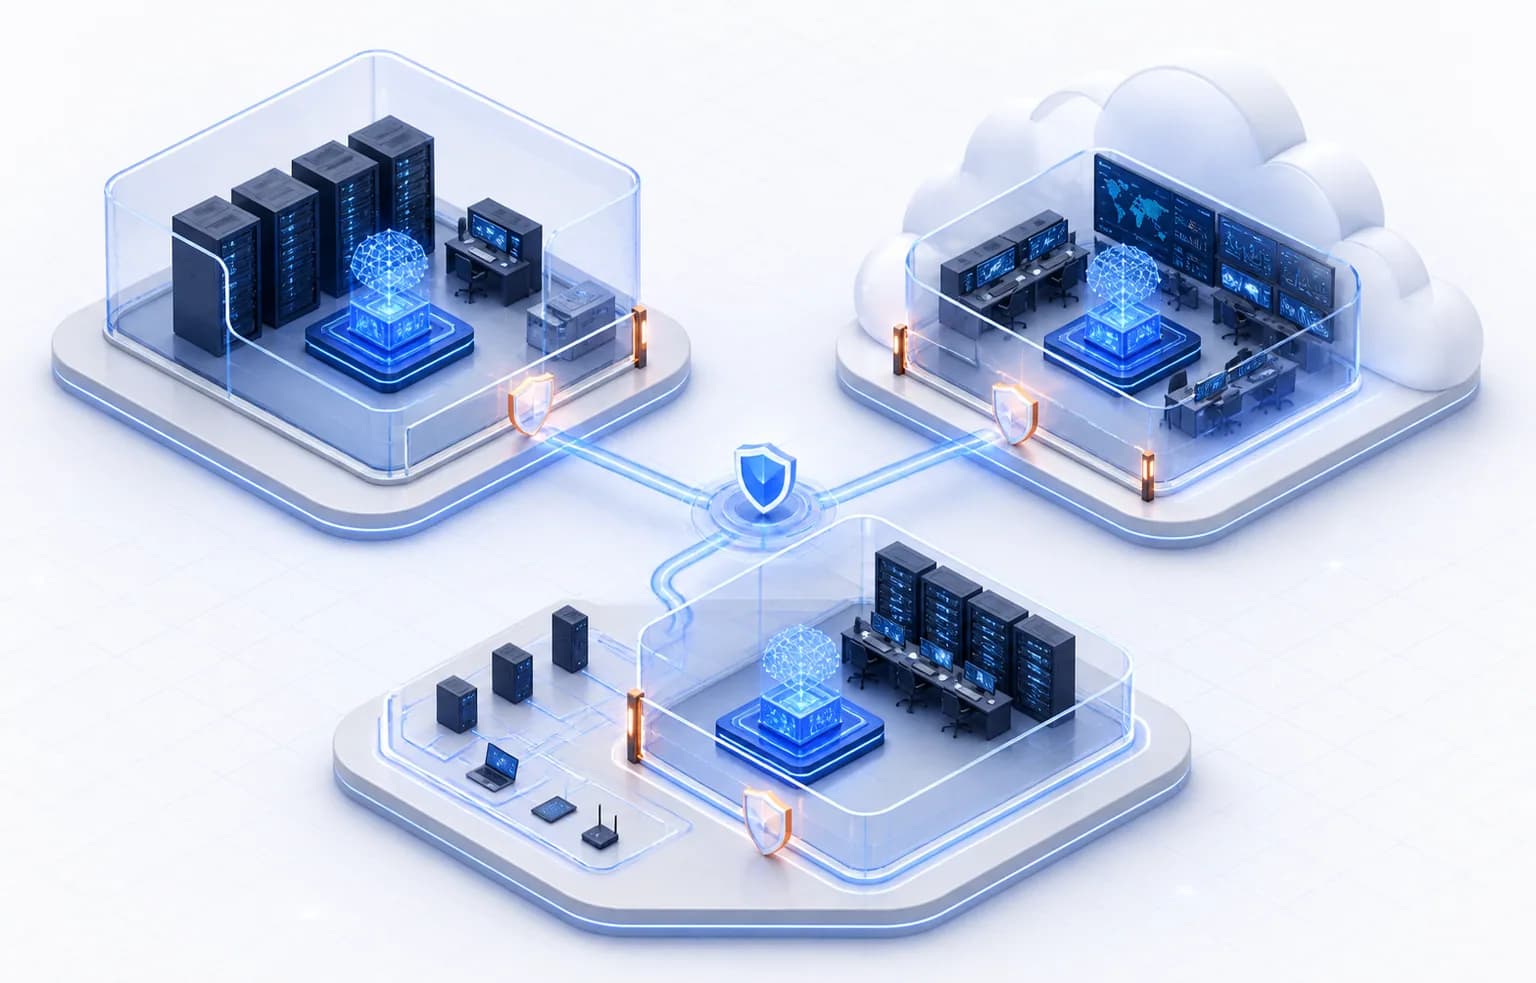
The platform runs entirely inside your infrastructure, on infrastructure we operate, or across both. This doesn’t change what gets detected. It changes where the trust boundary sits — and that’s your call, not your vendor’s.
On-premise
Entirely inside your infrastructure
Data residency obligations. Isolated networks. You already have an infrastructure team.
SOC-as-a-service (on-cloud)
Infrastructure we run, separated per client
You want a SOC quickly and don’t want to run a platform or staff a 24/7 rota.
Hybrid
Collected and normalised on site, analysed centrally
Sensitive data has to stay put, but you still want an outside monitoring team.
One thing holds across all three: the AI runs on local GPUs, and your logs are never sent to a public AI service. For fully isolated networks, the platform can demonstrate continuously that it has no route to the internet — evidence you can hand an auditor.
We operate from Vietnam and the UAE. So a data residency conversation in Southeast Asia or the Gulf starts with a team already in the region, not one flying in.
Log Plumber
Before you buy anything else, find out whether what you already own is talking.
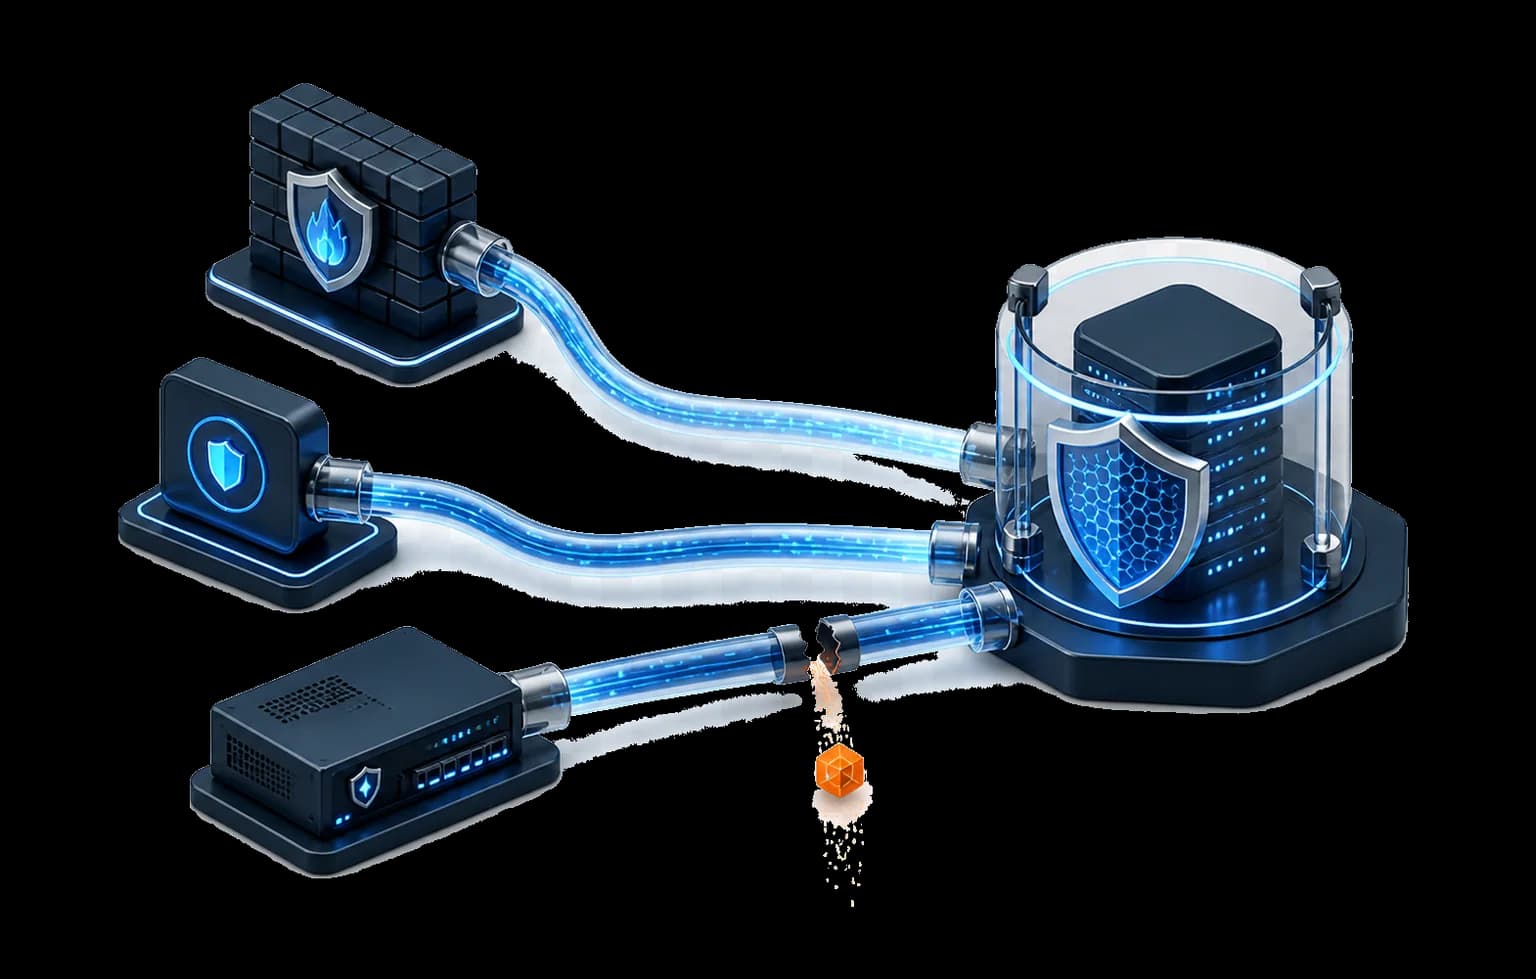
We call it plumbing for security data. We walk the path from sensor to storage and find the blockages, the leaks, and the pipes pointing the wrong way.
It’s usually the cheapest line in a security budget. It’s also the difference between having a SOC and having a SOC that works.
Part 1: Log Coverage Audit
We compare three things: the sources you think you collect, the sources actually arriving, and the sources you need to catch the techniques that matter, mapped to MITRE ATT&CK.
Those three sets almost never agree.
You get a coverage map by ATT&CK technique, a list of silent sources with the date each went quiet, blind spots ranked by risk, and a plan to close them in order.
Part 2: Sensor Hardening
Security products ship configured not to bother anyone. They log little, keep it briefly, and leave the forensically expensive event classes switched off. We reconfigure them to say something usable:
Endpoint security / EDR — turn on the process, command line, module load and file access events an investigation actually needs.
Firewall / IPS / IDS — log what’s allowed as well as what’s blocked, with enough fields to follow a session end to end.
NSM — put the sensor where the traffic really is, and capture session metadata and DNS rather than packet counts.
Servers, applications, cloud — enable audit logging, record command history, keep access logs at a level an investigation can use.
Two things go with this that almost nobody does. We load test it, so switching on more logging doesn’t take down the appliance producing it. And we verify it by attack simulation — we generate the attacker behaviour ourselves and confirm it shows up in your logs.
Correct on paper but silent under attack is still a blind spot.
Part 3: Open source vs commercial, against your budget
We don’t resell licences, so we have no reason to push you toward the expensive answer.
We sort your stack on one principle: open source where the real cost is people and you keep control; commercial where you’re buying response time, proprietary intelligence, or somebody else’s liability.
You get a layer-by-layer comparison with three-year TCO — staff included, not just licence price — a phased migration path, and a straight list of where open source is the wrong answer, with reasons.
What makes us different
Two centres, two countries
Our analysts work from Ho Chi Minh City and Dubai, both on a 24/7 rota. Two power grids, two internet paths, two public holiday calendars. When one centre goes dark, the other is already watching.
The AI runs inside your estate
None of your logs go to a public AI service. If you’re under data residency rules, that’s the difference between workable and not — not a feature to compare on a grid.
A human signs the verdict
The AI does the heavy, repetitive work. An analyst reaches the conclusion and owns it. We don’t sell automated response, because a wrong action on a production system usually costs more than the incident that triggered it.
We can measure what we detect
We separate rules that are wired from rules that are proven to fire. Every reporting cycle you get both numbers and the list of what’s still a blind spot. A coverage figure nobody can check isn’t a coverage figure.
In an incident, or trying to avoid one?
In one. Call the hotline. We take the call first and do the paperwork after.
Not in one. Start with a log coverage assessment. Fixed scope, fixed duration. The findings will tell you what to do next — including when the answer is “you don’t need a managed SOC yet”.